Tableau
Helping people find their path to data confidence
Product Designer and Content Strategist
2019 / 2 months

Methods
Content Strategy
UX Design
Information Architecture
Wireframing
UI Design
Prototyping
Design System Development
Usability Testing
Challenge
Tableau released new educational materials and wanted to organize them into role-based Learning Paths, which provide tailored training based on people’s roles and goals to help them get the most out of Tableau and increase platform usage. They needed a way to help people find the right path for them in a way that felt engaging and personal, which would encourage people to sign up for training subscriptions.
Context
We had a tight deadline of eight weeks for the first iteration. Once we read the proposed content, we knew it was centered too much around features and client-centered language, which we needed to rewrite around user needs and benefits to ensure product success.
Outcome
We developed and built the Learning Paths Assessment, which guided people to the right data training content for them and leveraged supporting content – like Tableau’s community features and articles – to help people discover other resources, which supported engagement activities that often led to purchasing learning courses and materials.
My Role
Product Designer and Content Strategist with support from one design director. I worked closely with the product manager, product owner, development team, and account manager. I developed the assessment logic and scoring, wrote the assessment content, designed the experience, and worked with the development team to build and QA the assessment with CSS.


Process
Discovery interviews and secondary research about the Tableau learning ecosystem
Content strategy improvements and copywriting to revise the existing content to center around things that would matter to and resonate with Learning Path users
Information architecture and wireframes to map the potential user flows and organization of content
UI design to develop a design system for the assessment
Usability testing to assess the content and flow
Development collaboration to work through proposed interaction patterns and capabilities
Challenges & Opportunities
We encountered three main challenges and opportunities during the process:
Content Challenges: The content we had to work with was feature- & client-centered language, not user-centered.
Starting from Behind: Our development team needed designs ready the first week to meet our deadline.
Expanding Awareness: We learned early on that Tableau had a rich ecosystem of educational offerings beyond Learning Paths and wanted to make people aware of this to increase their likelihood of success and continued engagement with Tableau
Challenge #1: Feature & client-centered language
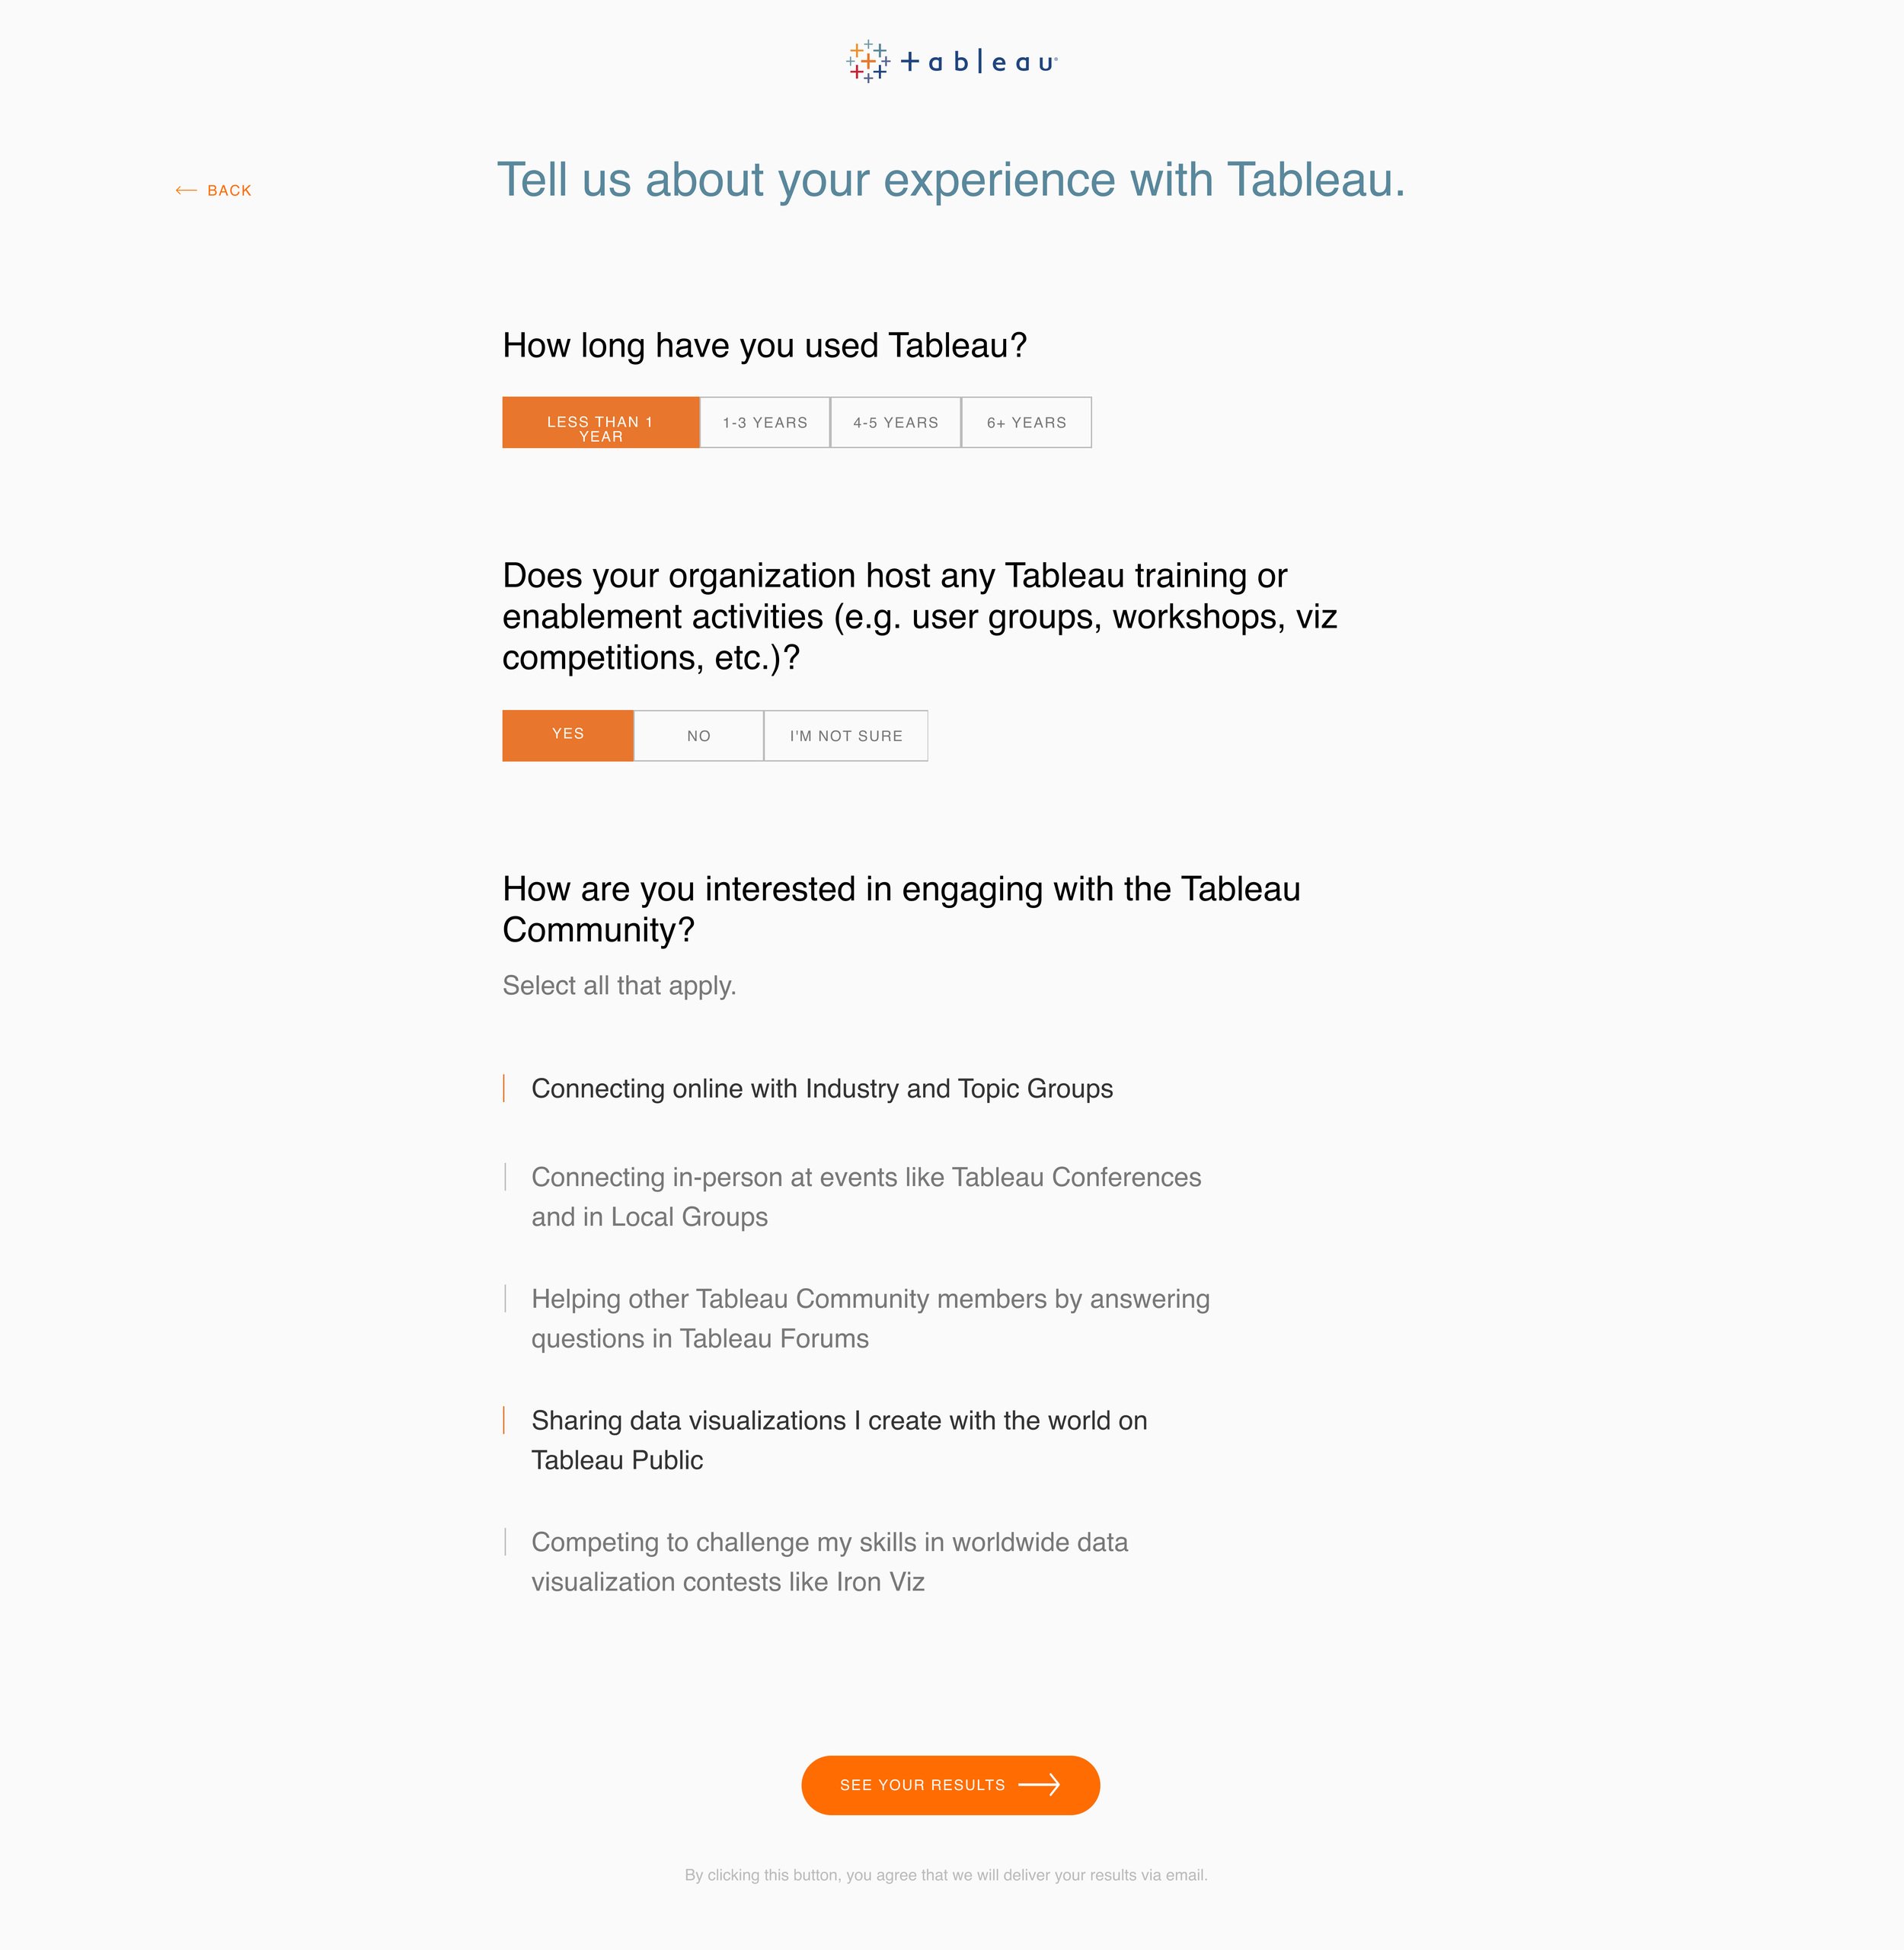
The initial content was heavy on product features and marketing speak, which we felt wouldn't resonate in a personalized assessment. We suspected this approach might decrease engagement. So, we rewrote everything to feel more like an exciting personality test, revealing new insights about the user and speaking to their goals and organizational impact when using Tableau.

We drafted new content for each learning path.


Challenge #2: Starting from behind
Our recently acquired company faced a tight timeline for the assessment, with the development team expecting designs by the end of the first week – before we had content developed. I knew we couldn't meet this expectation, so I identified component categories and static/dynamic elements, creating an experience flow that outlined each page, component types, and functionality. This allowed our development and product teams to start on features, APIs, and integrations without complete design comps.

Experience flow for the assessment (full size version)

Page architecture detail with components

Legend outlining the logic, component types, and interaction patterns to help our development team prepare without comps
Opportunity: Making people aware of the full breadth of educational offerings
We discovered Tableau had additional educational and social offerings like an active community and whitepapers. Our clients noted that engagement with these resources often led to increased product use over time. We saw an opportunity to include these on the results page, deepening product connection and offering personalized resources based on users' preferred engagement methods. We added questions about community and content preferences, reflecting these in personalized results.

Concept wireframes

Finalized results page. Note: some spacing may be off due to Sketch component changes.
Outcome
Assessment
We built Version One of the assessment in eight weeks, which was fully responsive.

Design System
I developed a design system for the assessment based on Tableau’s existing styles and component library (top) but using more expressive designs for form field elements than their design system supported at the time (bottom). These interpretations were iterated on with input from the Tableau design team.
Today, I would make different UI choices to upgrade the visual design and better support WCAG accessibility standards.


Impact
Our strategic approach led to subsequent phases to evolve the product, which turned the project into a multi-year engagement with iterative improvements and new work.
The assessment was a vital part of promotional efforts and materials for Blueprint Learning Paths products and received positive feedback from people across the organization. The assessment remained active for five years and the project led to additional work with Tableau for several years.
“They’re already talking about Phase 2 internally, understanding it will be complex and assuming we will be their partner. It goes without saying that it speaks to the quality and dedication of the team here.”